インストール
https://github.com/networkx/networkx/
$ pip install networkx
$ pip install decorator
Decoratorというのも必要っぽい。両方ともすでに入ってた。
サンプルコード
import networkx as nx

G=nx.Graph()
G.add_node("spam")
G.add_edge(1,2)
print(list(G.nodes()))
print(list(G.edges()))
結果
[1, 2, 'spam']
[(1, 2)]
使い方
matplotlibでグラフを表示する
https://networkx.readthedocs.io/en/stable/tutorial/tutorial.html
import matplotlib.pyplot as plt
nx.draw(G)
plt.show()
サンプルコード
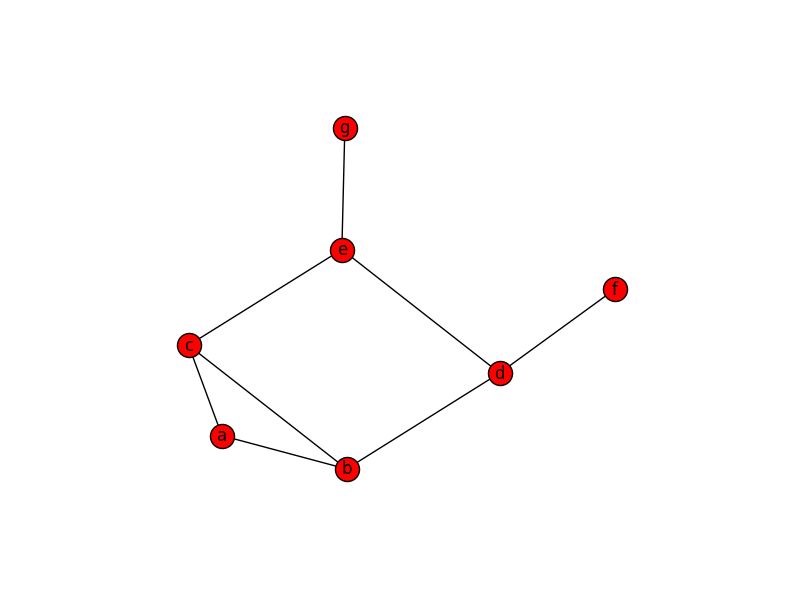
import numpy as np
import matplotlib.pyplot as plt
import networkx as nx

#隣接行列
g = np.array([
    [0, 1, 1, 0, 0, 0, 0],
    [1, 0, 1, 1, 0, 0, 0],
    [1, 1, 0, 0, 1, 0, 0],
    [0, 1, 0, 0, 1, 1, 0],
    [0, 0, 1, 1, 0, 0, 1],
    [0, 0, 0, 1, 0, 0, 0],
    [0, 0, 0, 0, 1, 0, 0]
])
nodes = np.array(['a', 'b', 'c', 'd', 'e', 'f', 'g'])
G = nx.Graph()
G.add_nodes_from(nodes)
edges = []
for hi, hv  in enumerate(g):
    for wi, wv in enumerate(hv):
        if(wv): edges.append((nodes[hi], nodes[wi]))
G.add_edges_from(edges)
pos = nx.spring_layout(G)
nx.draw_networkx(G, pos, with_labels=True)
plt.axis("off")
plt.show()
参考: [Python]NetworkXでQiitaのタグ関係図を描く Pythonで迷路を解く - アルゴリズムクイックリファレンス6章の補足 - NetworkXでグラフを描いた(最短経路他)