Python3 - xのn乗のグラフ(matplotlibのsubplotとアニメーション)
GIFアニメーション
matplotlibのアニメーション作成は2つ種類があって、ArtistAnimationとFuncAnimationとがある。
ArtistAnimation は、あらかじめ全てのグラフを配列の形で用意しておき、それを1枚ずつ流すというものである。FuncAnimationは予め完成したグラフを渡すのではなく、アニメーションの1フレームごとに関数を実行する。データが巨大すぎる場合や潜在的に無限に続く場合に便利。
ArtistAnimation
ArtistAnimationを使って、xの2乗~10乗のグラフを配列に入れて、アニメーションをつくってみる。
サンプルコード
import numpy as npimport matplotlib.pyplot as pltimport matplotlib.animation as animation
def xpown(s, e):    graphs = []    fig = plt.figure()    for n in range(s, e + 1):        x = np.arange(-100, 100, 0.1)        y = x ** n        g = plt.plot(x, y, label='y = x ** {}'.format(n))        graphs.append(g)    plt.legend()    ani = animation.ArtistAnimation(fig, graphs, interval=500)    ani.save('pow1.gif', writer='imagemagick')
if __name__ == '__main__':    xpown(2, 10)
結果 
これだと、10乗のグラフのyが大きすぎて、他がみんな直線みたいになってしまった。
FuncAnimation
FuncAnimationを使ってやってみる。
import numpy as npimport matplotlib.pyplot as pltimport matplotlib.animation as animation
x = np.arange(-100, 100, 0.1)n = 1max = 10fig = plt.figure()
def plot_pow(data):    plt.cla()    global n    n = n + 1 if n < max else 2    y = x ** n    im = plt.plot(x, y, label='y = x ** {}'.format(n))    plt.legend()
if __name__ == '__main__':    ani = animation.FuncAnimation(fig, plot_pow, interval=400, frames=9)    ani.save("pow2.gif", writer="imagemagick")
結果 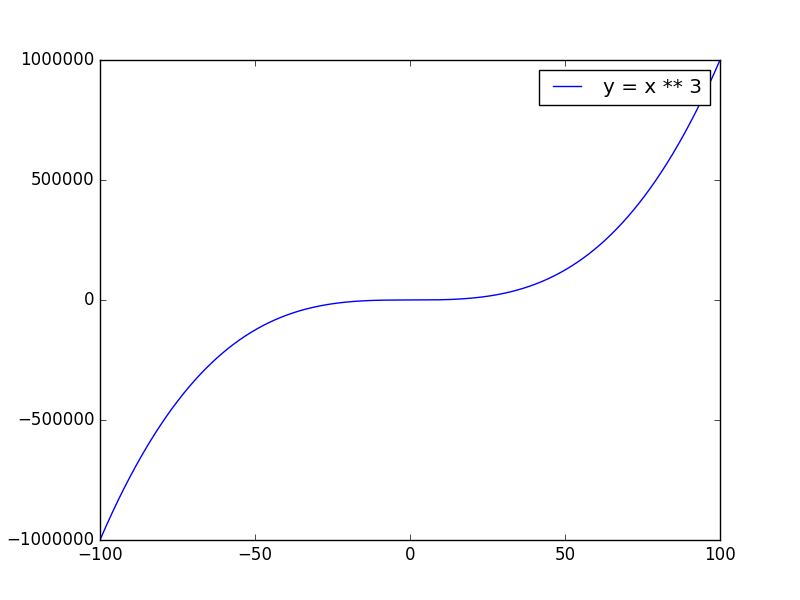
指数が偶数ならy軸に対称のグラフになり、奇数なら原点に対象のグラフになります。原点に対象っていうのか。
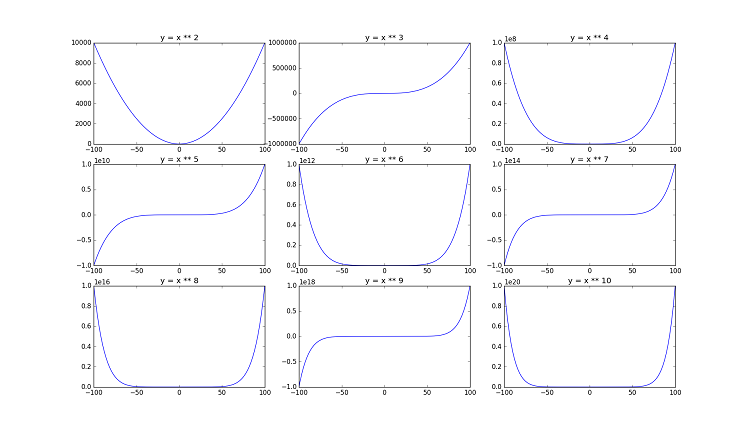
Subplot
matplotlibで複数のグラフを表示したいときにsubplotが使えます。 参考:[Python]Matplotlibで複数のグラフを描画する方法
サンプルコード
import numpy as npimport matplotlib.pyplot as plt
x = np.arange(-100, 100, 0.1)fig = plt.figure()ax = []for i in range(9):    y = x ** (i ++ 2)    ax.append(plt.subplot2grid((3, 3), (i // 3, i % 3)))    ax[i].set_title('y = x ** {}'.format(i + 2))    ax[i].plot(x, y)plt.show()
結果